SaaS Dashboard · $15,000 · flat, designed and coded in about 2 weeks
The dashboard, designed and running
One dashboard, the screen your customers open every day: the KPIs, the charts, the tables, the filters, and every empty, loading, and error state. Designed, then built as a working front-end in your stack and wired to your API, so what you get plugs in instead of getting handed to a developer to interpret. Not a Figma file.
Or book a 20-minute call first. No pitch, just fit.
01
Live code, not a design file
The deliverable is a working front-end in your stack, typically React or Next.js with your component library, wired to your API or to realistic sample data. Your developers plug it in; they do not rebuild it.
02
Every state, because dashboards are mostly states
Empty, loading, partial, error, zero-data, first-week, and the one where the number is bad. Most dashboards are designed for the happy path and fall apart on Monday morning.
03
The decision drives the screen
Day one is spent on what the person looking at this has to decide. The charts, the hierarchy, and the defaults follow from that, not from the charting library's menu.
Receipts
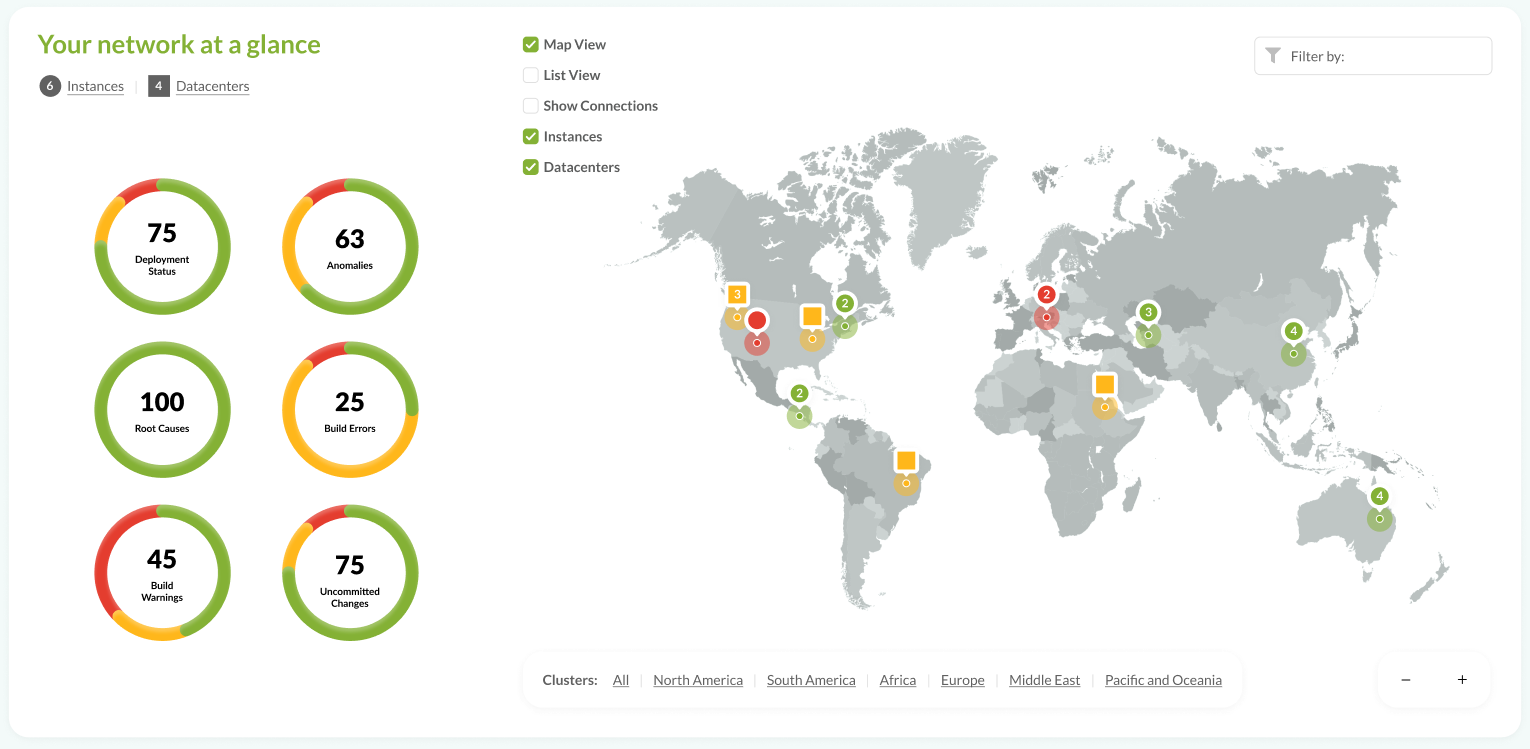
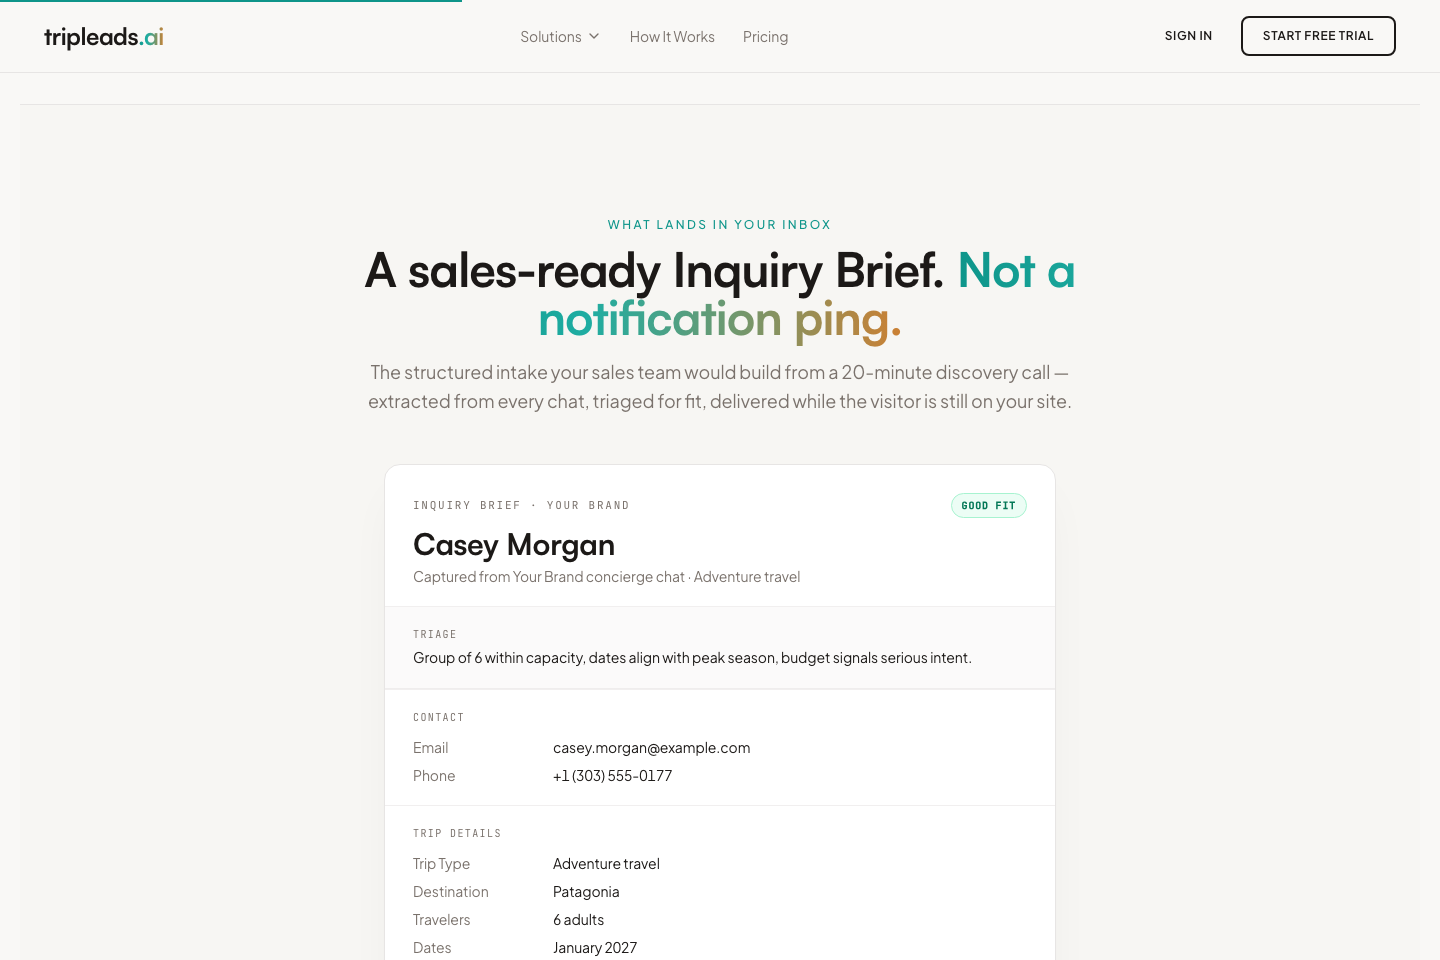
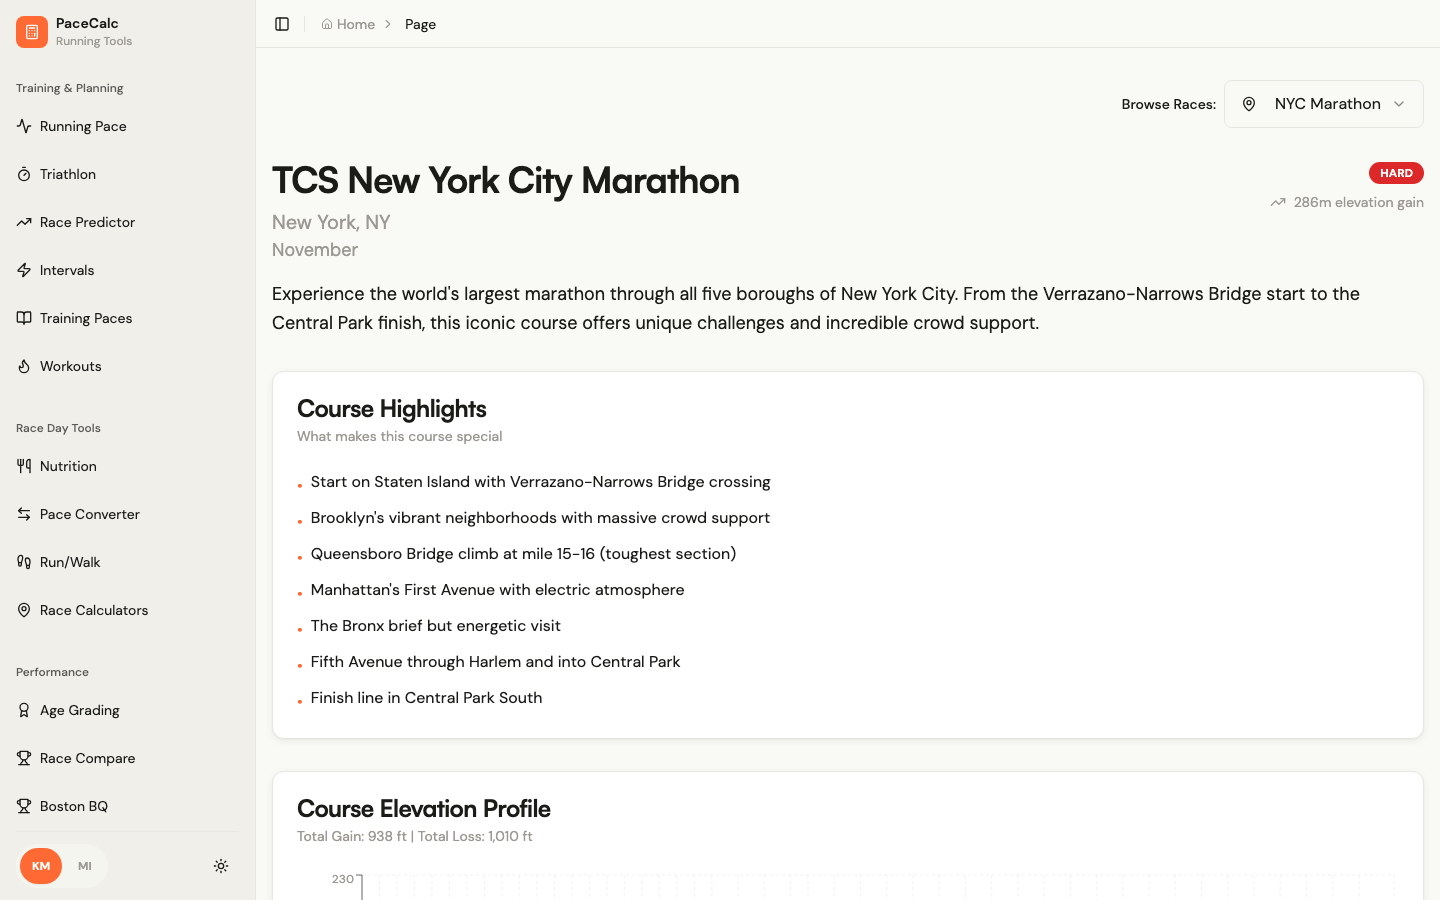
Screens people read every day.
Each opens the case study.
What ships
One dashboard, designed and built.
One screen and its states is the honest scope of two weeks. A second view, or a dataset that needs custom rendering, is quoted before the first day.
Designed
- The decisions. What the viewer decides here, written down on day one. The screen follows from it.
- Information design. Hierarchy, defaults, and the right chart for each question, not the library's default.
- Every state. Empty, loading, partial, error, zero-data, and first-week, all designed.
- Responsive. Legible on a laptop, a wide monitor, and the phone someone checks it on at 7am.
Built
- Working front-end. React or Next.js in your stack and your component library, as a pull request in your repo.
- Wired. To your API where it exists, to realistic sample data where it does not, with the contract documented.
- Charts that hold up. A charting library where it is enough, hand-tuned rendering where the data volume demands it.
- Handoff. A running deploy to click through, the Figma source, and a screencast for your developers.
Pricing
Two ways to buy it.
The dashboard covers one screen with a charting library under it. When the data itself is the hard part, the tier above is the right one.
SaaS Dashboard
$15,000
Flat. One dashboard and every state, designed and built as a working front-end, about two weeks.
- The decisions the screen serves, agreed on day one
- Information design and every state, reviewed by screencast
- Working front-end in your stack, wired to your API or sample data
- A running deploy, the Figma source, a developer walkthrough
- Pull request in your repo, yours
The data is the hard part?
From $30,000
Complex Data Visualization: custom rendering for networks, time series, geospatial, and real-time data at real volume.
- A working prototype of the hardest view, with real data
- Canvas, WebGL, or SVG chosen by the data, hand-tuned
- Exploration designed: filter, drill, compare
- Production code in your stack
How it runs
Ten business days, brief to running.
01
Days 1 to 2
Decisions and data
What the viewer has to decide, and the shape of the data behind it. API contract or sample data agreed.
02
Days 3 to 5
Designed, every state
The screen and its states in Figma, reviewed by screencast. Revisions inside the week.
03
Days 6 to 9
Built in your stack
The working front-end, wired to your API or sample data, as a pull request. You click through a running deploy.
04
Day 10
Handoff
Merged or ready to merge, the Figma source, and a screencast walking your developers through the code.
Fit check
Built for some, not everyone.
This is for you if
- A SaaS product whose main screen is a dashboard nobody has had time to design properly
- A team with a backend and an API, and a front-end that needs the screen built, not described
- A reporting or analytics view customers ask for that keeps slipping down the roadmap
Not built for
- A whole admin area. That is a Design Sprint for the screens, then a Sprint or Cadence to build it
- Data that needs custom rendering at scale. That is Complex Data Visualization
- A static report or a one-off chart

Designed and coded, one seat
Artyom Sklyarov
Dashboards die in the handoff: the designer draws the happy path, the developer meets the empty state, and the result is neither. I design the screen and write the front-end, so the states are real, the numbers fit, and what you approve is what runs.
You get a pull request and a running deploy, not a file someone has to interpret.
Start your dashboard
Tell me about the screen and the data behind it. I'll personally review it and reach out within 24 hours.
Step 1 of 3
About you
The fine print
Questions, answered.
A working front-end for one dashboard in your stack, typically React or Next.js with your component library, wired to your API or to realistic sample data with the contract documented, delivered as a pull request in your repo plus a running deploy to click through. The Figma source and a screencast for your developers come with it.
$15,000 flat for one dashboard and every state, designed and built in about two weeks. A second view is quoted before the first day starts. If the data needs custom rendering at scale, that is the Complex Data Visualization tier, not this one.
No, and that is the point. The dashboard ships as running code your developers plug in, not as a Figma file they have to rebuild. The design happens first, in days three to five, and the build follows in the same two weeks.
React and Next.js are the default, with your existing component library and design tokens where you have them. Vue or Svelte are fine; the fit call confirms it. Charts use a library where it is enough and hand-tuned rendering where the data volume demands it.
The dashboard is built against realistic sample data with the API contract documented, so your backend team has a spec and the front-end drops onto the real endpoint when it exists.
One dashboard is the scope, because it is what two weeks can do properly. For the screens around it, a Design Sprint covers up to about fifteen; to build them, a Product Sprint or Cadence picks up the file from the same person. If the product's front-end needs a design system underneath, that is an add-on at From $12,000.
01 / 06
What exactly do I receive?
A working front-end for one dashboard in your stack, typically React or Next.js with your component library, wired to your API or to realistic sample data with the contract documented, delivered as a pull request in your repo plus a running deploy to click through. The Figma source and a screencast for your developers come with it.
Ready? Start my dashboard. Day one is spent on what the viewer decides; day ten ends with a pull request.