Complex Data Visualization · From $30,000 · scoped per dataset, four to eight weeks
Make the hard data legible
When the dataset is genuinely complex (graphs, time series, networks, geospatial, real-time) off-the-shelf charts give up. Custom, performant visualization a real person can read and act on, designed and engineered as one thing by one senior, so legibility and performance are the same decision.
Or book a 20-minute call first. No pitch, just fit.
01
The decision drives the encoding
Information design starts from the question the user is asking and the decision it serves, not from the library's default chart types.
02
Built for real volume
Canvas, WebGL, or SVG chosen by the shape and scale of the data. Hand-tuned rendering holds up at a hundred thousand points where a library stutters.
03
Exploration, not a poster
Filter, drill, compare, and hover designed as interaction, accessible and responsive, legible on a laptop and on a boardroom screen.
Receipts
Data made readable.
Each opens the case study.
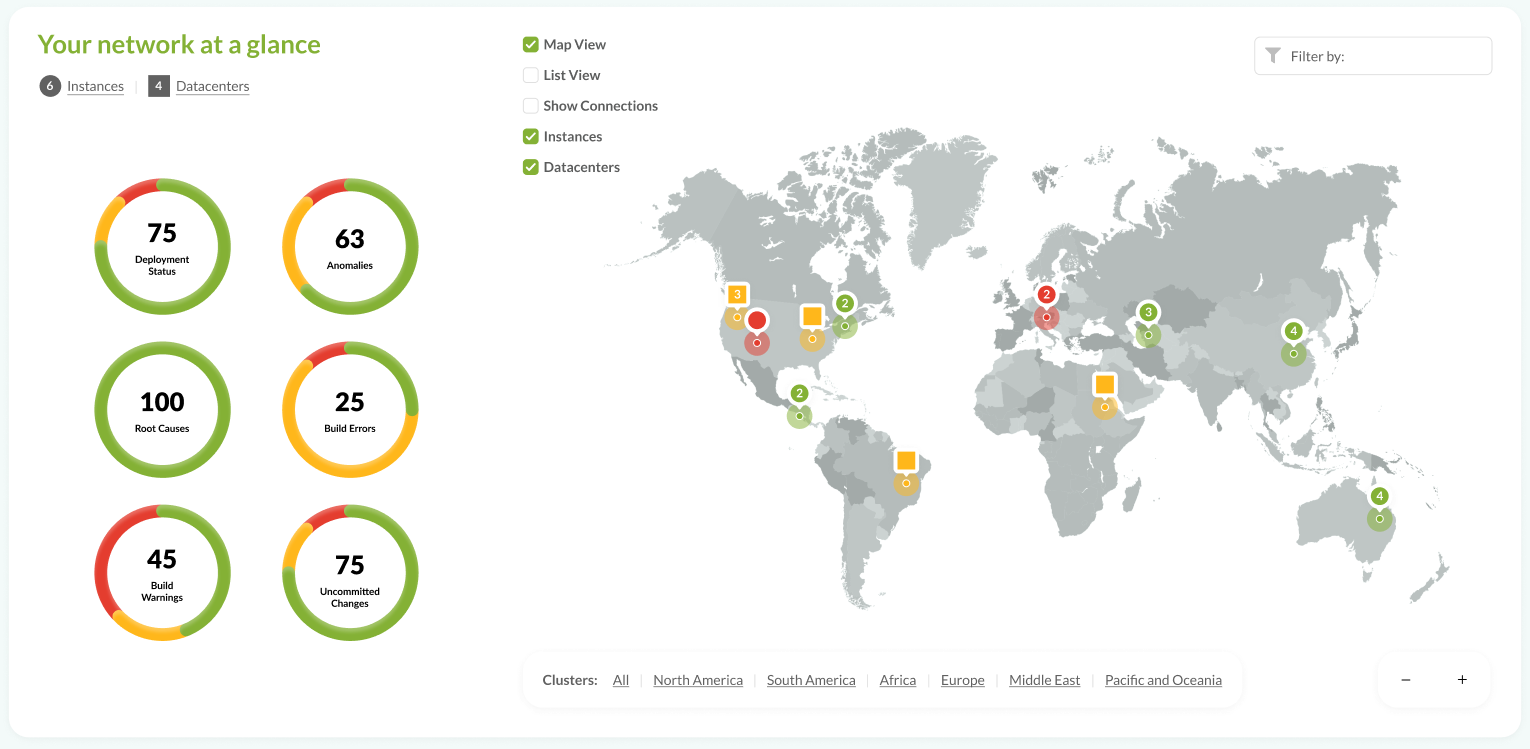
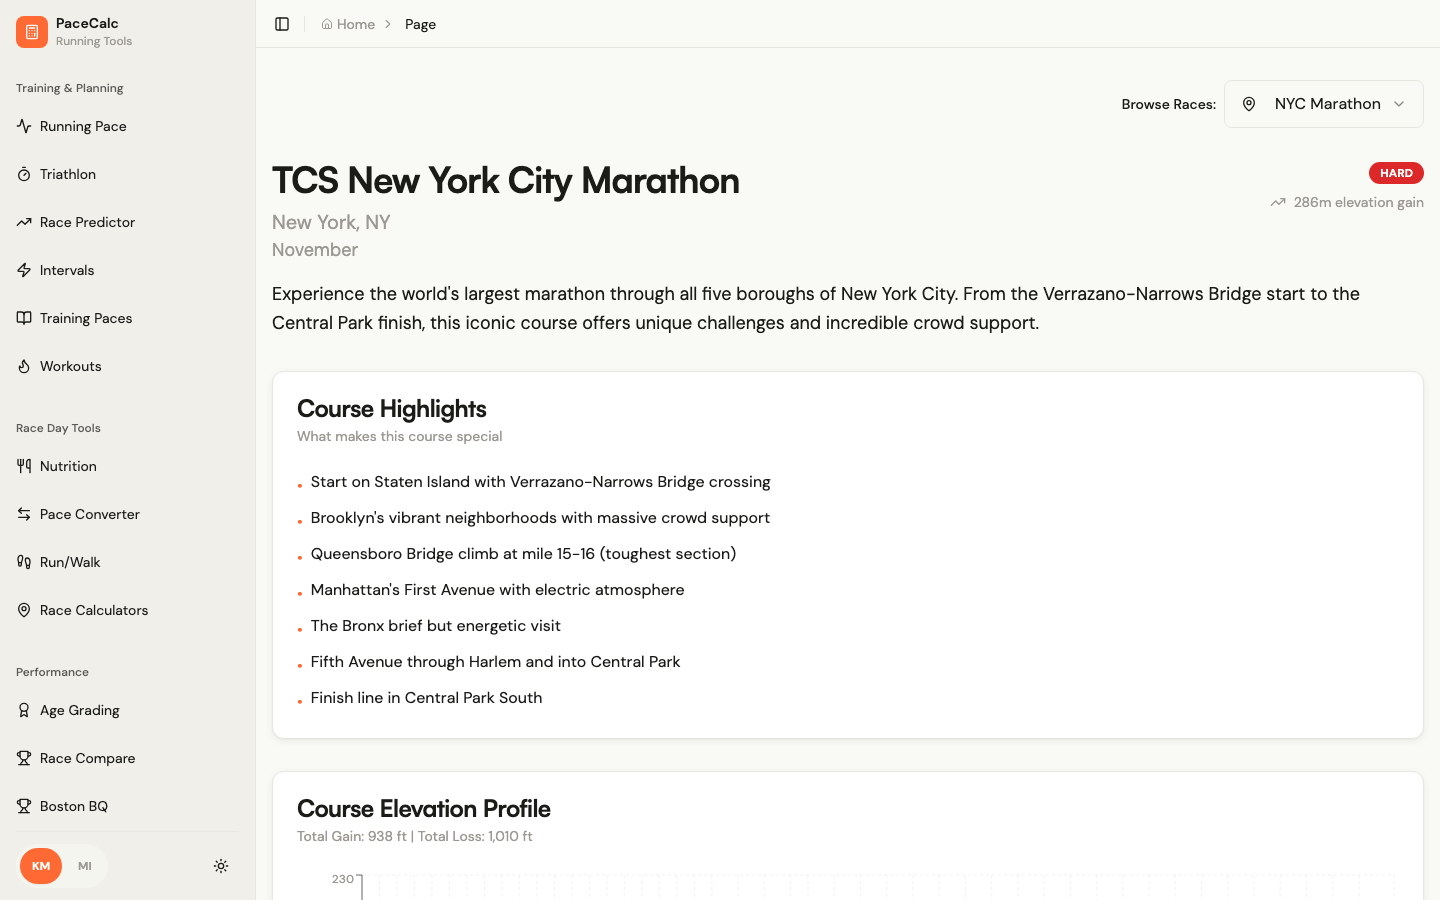
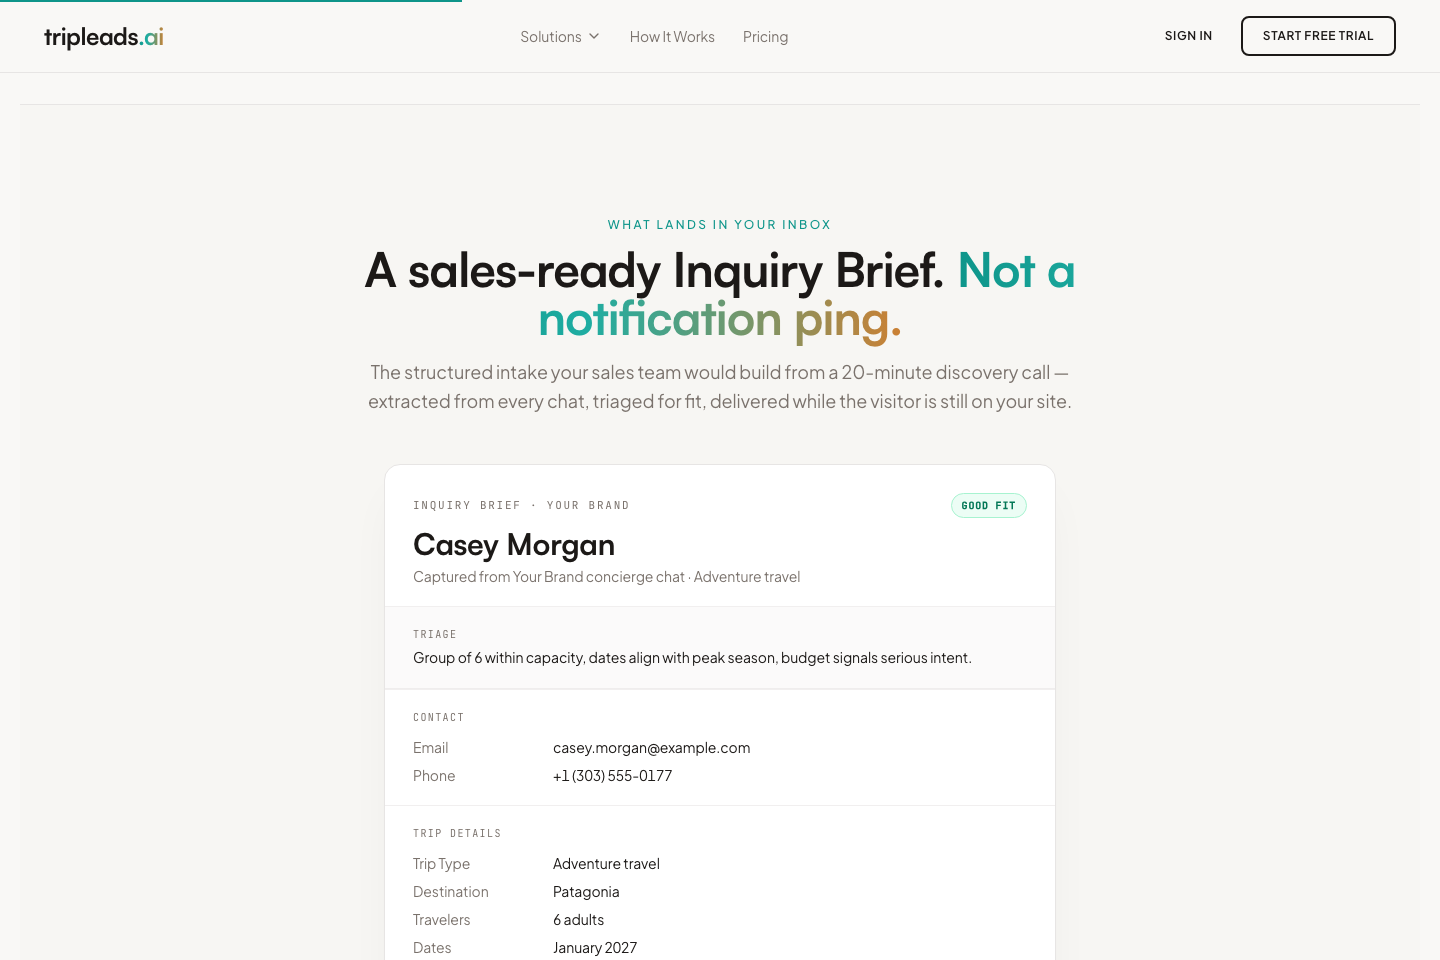
What ships
Encoding, rendering, and the interaction.
Scoped per dataset and surface on the fit call. The hardest view is prototyped with real data before the full build is quoted.
Design
- Information design. Grounded in the actual data and the decision it serves.
- The encoding. Position, color, size, and motion chosen for the question, not the library.
- Interaction. Filter, drill, compare, hover, and the states in between.
- Accessible and responsive. Legible on a laptop, a boardroom screen, and to a screen reader.
Engineering
- Rendering. Canvas, WebGL, or SVG by the shape and scale of the data, hand-tuned.
- Real-time. Streaming and live updates inside the render budget from the start.
- Integration. A production component in your stack, owned by you.
- Performance budget. Measured against real data volume, not a sample.
Pricing
Scoped per dataset.
The floor covers one complex view built end to end. Multi-view consoles are quoted on the fit call after the prototype.
Complex Data Visualization
From $30,000
Scoped per dataset and surface, quoted before it starts. Most ship in four to eight weeks.
- Information design grounded in the decision
- A working prototype of the hardest view, with real data
- Custom, performant rendering at real scale
- Interaction for exploration, accessible and responsive
- Production code in your stack, owned by you
A dashboard, not a dataset?
$15,000
The SaaS Dashboard: one screen and every state, designed and built as a working front-end in about two weeks, when a charting library is enough.
- The decisions the screen serves, agreed on day one
- Every state designed
- Working front-end in your stack, wired to your API
- Pull request in your repo
How it runs
Four to eight weeks, fit call to integrated.
01
Day 0
Fit call
The data, the scale, and the decision it has to support. Library or custom, decided honestly.
02
Week 1
Map
Data shape and the question the user is actually asking. The encoding chosen.
03
Weeks 2 to 3
Prototype
A working render of the hardest view, moving with real data. The full build is quoted here.
04
Weeks 4 to 8
Build
The production component integrated into your stack, measured at real volume.
Fit check
Built for some, not everyone.
This is for you if
- Data products where the chart IS the product
- Teams past the limits of a charting library
- Dashboards executives genuinely need to read
Not built for
- A standard bar-and-line dashboard: use a library
- One-off report graphics

Design and render, one seat
Artyom Sklyarov
Most data viz is either pretty and useless or accurate and unreadable. I design the encoding and write the render code, so performance and legibility are the same decision. Twenty years of it, most recently on network consoles where an operator's glance is the whole product.
If a library is enough, I will tell you on the fit call. Custom is only worth it when the data demands it.
Complex Data Visualization · From $30,000
Tell me about the data.
Name, email, and a few lines: what the data is, how much of it there is, and what decision someone makes with it. I reply within 24 hours with a fit read.
The fine print
Questions, answered.
D3, Canvas, or WebGL: chosen by the shape and scale of the data, not habit.
Yes. Streaming and live updates are part of the render budget from the start.
I'll tell you honestly if a charting library is enough, custom is only worth it when the data demands it.
From $30,000 for one complex view designed and built end to end. The hardest view is prototyped with real data first, and multi-view consoles are quoted from that prototype, not from a guess.
Yes. A production component in your stack, in your repo, with the rendering documented so your team can extend it.
01 / 05
What tech?
D3, Canvas, or WebGL: chosen by the shape and scale of the data, not habit.
Ready? Request a fit call. The hardest view gets prototyped with real data before the full build is quoted.